Multiple Choice
Exhibit 21-6 The graph below illustrates various cost behavior patterns in XYZ Company.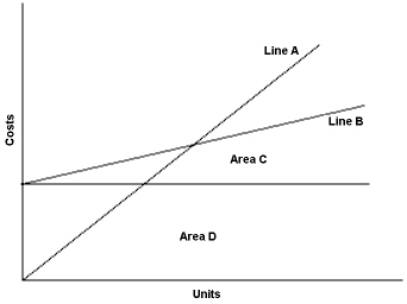
-Refer to Exhibit 21-6. In the graph above, the variable costs are represented by:
A) Line A
B) Line B
C) Area C
D) Area D
Correct Answer:

Verified
Correct Answer:
Verified
Q63: Exhibit 21-3 The following partial income statement
Q64: If total costs are $27,000 and $36,000
Q65: When the variable cost ratio decreases, the:<br>A)
Q66: Everclean Company cleans draperies. It charges $75
Q67: Stanley Company manufactures and sells one product
Q69: Which of the following costs would LEAST
Q70: XYZ Company generally produces between 200 and
Q71: Operating leverage is:<br>A) The proportion of total
Q72: Everclean Company cleans draperies. It charges $75
Q73: Jones Company sells two products, Gumbo and