Multiple Choice
Exhibit 21-7 Use the cost-volume-profit graph below to answer the following question(s) .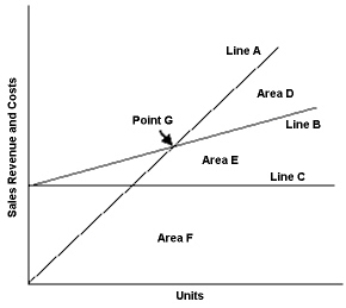
-Refer to Exhibit 21-7. Area D on the cost-volume-profit graph represents the:
A) Profit area
B) Total costs
C) Loss area
D) Fixed costs
Correct Answer:

Verified
Correct Answer:
Verified
Related Questions
Q115: The two components of a mixed cost
Q116: Which of the following is NOT true
Q117: Exhibit 21-2 The following cost data are
Q118: When other factors remain constant, a decrease
Q119: Within the relevant range, variable costs are
Q121: Newport Corporation is planning to sell 50,000
Q122: A firm will break even when:<br>A) Revenues
Q123: As activity level increases within the relevant
Q124: Within the relevant range some fixed costs
Q125: The slope of the line in a