Multiple Choice
Exhibit 21-8 Use the profit graph below to answer the following question(s) .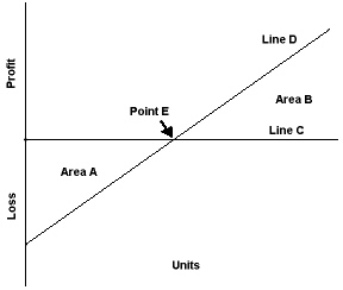
-Refer to Exhibit 21-8. Area A on the profit graph represents the:
A) Profit area
B) Total costs
C) Loss area
D) Break-even point
Correct Answer:

Verified
Correct Answer:
Verified
Related Questions
Q121: Newport Corporation is planning to sell 50,000
Q122: A firm will break even when:<br>A) Revenues
Q123: As activity level increases within the relevant
Q124: Within the relevant range some fixed costs
Q125: The slope of the line in a
Q127: Given the following information, draw a profit
Q128: Which of the following is the formula
Q129: The excess of sales over variable costs
Q130: <img src="https://d2lvgg3v3hfg70.cloudfront.net/TB1384/.jpg" alt=" is the formula for:
Q131: If total sales are $460,000, total variable