Multiple Choice
Exhibit 21-8 Use the profit graph below to answer the following question(s) .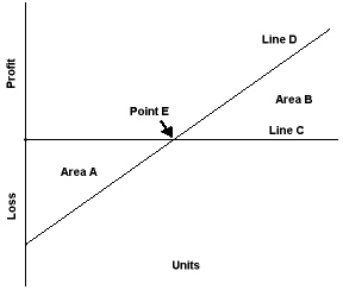
-Refer to Exhibit 21-8. Area B on the profit graph represents the:
A) Profit area
B) Total costs
C) Loss area
D) Break-even point
Correct Answer:

Verified
Correct Answer:
Verified
Related Questions
Q44: Duke Corporation sells fans for $20 per
Q45: Within the relevant range, per-unit variable cost:<br>A)
Q46: Maintaining low fixed costs and high variable
Q47: Challis Company had sales of $450,000 and
Q48: Given the equation $500X = $300X +
Q50: The relevant range refers to the activity
Q51: Stone Company plans to sell 200,000 calculators.
Q52: Fixed costs per unit:<br>A) Remain constant as
Q53: C-V-P analysis is useful to managers in:<br>A)
Q54: To reach a target income of $20,000,