Multiple Choice
 The slope of the budget line in the graph shown:
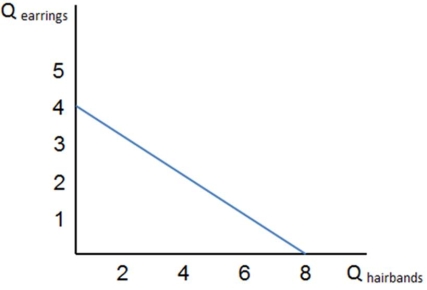
A) represents the opportunity cost of the two goods relative to each other.
B) represents the relative marginal utilities from consuming the two goods.
C) measures the total utility the consumer gets from consuming the two goods.
D) is the consumer's income level.
Correct Answer:

Verified
Correct Answer:
Verified
Q29: Utility is:<br>A)a quantitative measure of consumers' preferences.<br>B)an
Q47: <img src="https://d2lvgg3v3hfg70.cloudfront.net/TB1248/.jpg" alt=" If the graph
Q48: Sam has $200 a month to spend
Q49: The concept of diminishing marginal utility:<br>A) explains
Q50: <img src="https://d2lvgg3v3hfg70.cloudfront.net/TB1248/.jpg" alt=" Assume the graph
Q51: <img src="https://d2lvgg3v3hfg70.cloudfront.net/TB1248/.jpg" alt=" Assume Bonnie has
Q53: <img src="https://d2lvgg3v3hfg70.cloudfront.net/TB1248/.jpg" alt=" Assume Mimi's budget
Q55: A budget constraint is:<br>A) a line that
Q56: Rational utility maximizing consumers tend to:<br>A) buy
Q57: <img src="https://d2lvgg3v3hfg70.cloudfront.net/TB1248/.jpg" alt=" Consider budget constraints