Multiple Choice
This graph shows three different budget constraints: A,B,and C. 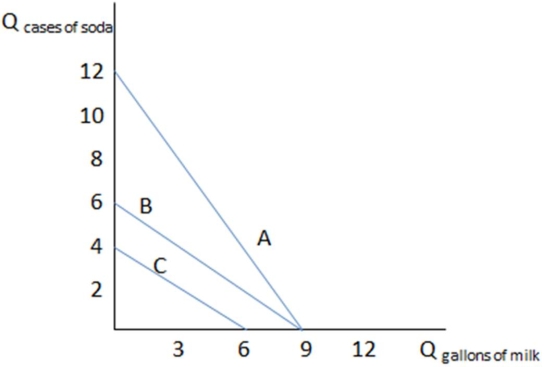
If Don has budget constraint C in the graph shown,what is the trade-off he faces in terms of the two goods?
A) Two cases of soda for every three gallons of milk
B) One case of soda for every one and a half gallons of milk
C) Three cases of soda for every four and a half gallons of milk
D) All of these accurately reflect Don's tradeoff.
Correct Answer:

Verified
Correct Answer:
Verified
Q120: In general,an increase in the price of
Q121: When the price of one good changes,while
Q122: A budget constraint:<br>A) shows different bundles of
Q123: Reciprocity means:<br>A) responding to another's actions with
Q124: Which of the following statements is true
Q125: Kimberly decides to go back to college
Q126: After browsing several pairs of shoes,Bob buys
Q127: <img src="https://d2lvgg3v3hfg70.cloudfront.net/TB1248/.jpg" alt=" Assume Roger's income
Q129: A bundle:<br>A) is a specific combination of
Q130: <img src="https://d2lvgg3v3hfg70.cloudfront.net/TB1248/.jpg" alt=" If the graph