Multiple Choice
This graph shows three different budget constraints: A,B,and C. 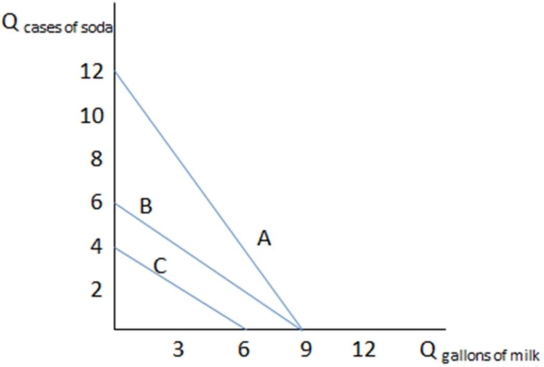 If Larry has budget constraint B in the graph shown,what is his opportunity cost of one gallon of milk?
A) It is 6 cases of soda.
B) It is exactly one case of soda.
C) It is less than one case of soda.
D) It is more than one case of soda.
Correct Answer:

Verified
Correct Answer:
Verified
Q14: Utility measurements are:<br>A) a relative ranking of
Q15: Grace has just eaten a slice of
Q16: This table shows the different combinations of
Q17: This graph shows three different budget constraints:
Q19: Nick has $300 a month to spend
Q20: <img src="https://d2lvgg3v3hfg70.cloudfront.net/TB1248/.jpg" alt=" Assume Willow's income
Q21: Nona has just gone on a bike
Q22: Corey has a blue sweater and a
Q23: A budget constraint:<br>A) shows a constant dollar
Q131: Individuals will make choices to maximize their:<br>A)constraints.<br>B)utility.<br>C)income.<br>D)values.