Multiple Choice
This graph shows three different budget constraints: A,B,and C. 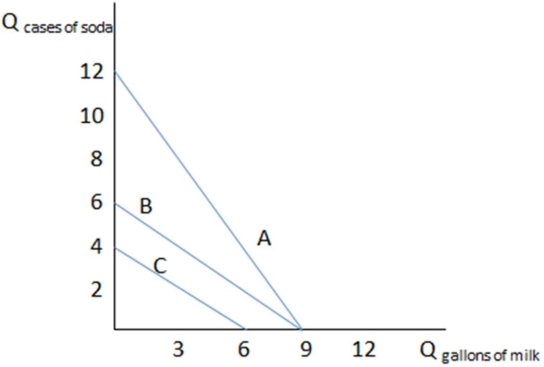 If Bert has budget constraint A in the graph shown,what is his opportunity cost of three gallons of milk?
A) Twelve cases of soda
B) Eight cases of soda
C) Four cases of soda
D) It is impossible to say without knowing Bert's income.
Correct Answer:

Verified
Correct Answer:
Verified
Q87: The substitution effect can be defined as:<br>A)
Q88: Utility is:<br>A) a way of describing a
Q89: If Bella eats one piece of pie,she
Q90: When a person's income increases:<br>A) the individual's
Q91: <img src="https://d2lvgg3v3hfg70.cloudfront.net/TB1248/.jpg" alt=" If the graph
Q93: Altruism describes:<br>A) a motive for action in
Q94: The concept of utility maximization:<br>A) is solely
Q95: This table shows the different combinations of
Q96: <img src="https://d2lvgg3v3hfg70.cloudfront.net/TB1248/.jpg" alt=" If the graph
Q97: This table shows the different combinations of