Multiple Choice
 According to the graph shown,producer surplus is area:
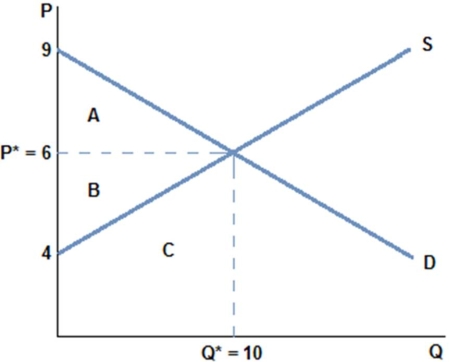
A) A + B + C.
B) B.
C) A.
D) A + B.
Correct Answer:

Verified
Correct Answer:
Verified
Q39: Each seller's opportunity costs are:<br>A) determined monetarily,
Q101: When the market price is set above
Q102: A market has four individuals,each considering buying
Q103: <img src="https://d2lvgg3v3hfg70.cloudfront.net/TB1248/.jpg" alt=" Assuming the market
Q104: When a perfectly competitive,well-functioning market is not
Q105: <img src="https://d2lvgg3v3hfg70.cloudfront.net/TB1248/.jpg" alt=" Assuming the market
Q107: <img src="https://d2lvgg3v3hfg70.cloudfront.net/TB1248/.jpg" alt=" According to the
Q109: Which of the following prices could represent
Q110: What consumer surplus is received by someone
Q111: If Sam's opportunity cost of a sweater