Multiple Choice
 According to the graph shown,if the market goes from equilibrium to having its price set at $10 then:
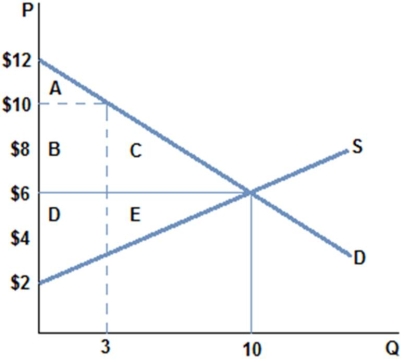
A) producer surplus rises by area B,but falls by area E.
B) producer surplus rises by area B,but falls by area D + E.
C) producer surplus rises by area B + C,but falls by area D + E.
D) producer surplus rises by area B + C,but falls by area E.
Correct Answer:

Verified
Correct Answer:
Verified
Q26: In economics,the concept of surplus:<br>A) measures the
Q27: <img src="https://d2lvgg3v3hfg70.cloudfront.net/TB1248/.jpg" alt=" According to the
Q28: A market has four individuals,each considering buying
Q29: Assume there are three hardware stores,each willing
Q30: <img src="https://d2lvgg3v3hfg70.cloudfront.net/TB1248/.jpg" alt=" According to the
Q32: <img src="https://d2lvgg3v3hfg70.cloudfront.net/TB1248/.jpg" alt=" According to the
Q33: <img src="https://d2lvgg3v3hfg70.cloudfront.net/TB1248/.jpg" alt=" Assume the market
Q34: Assume a market that has an equilibrium
Q35: <img src="https://d2lvgg3v3hfg70.cloudfront.net/TB1248/.jpg" alt=" According to the
Q36: Assume there are three hardware stores,each willing