Multiple Choice
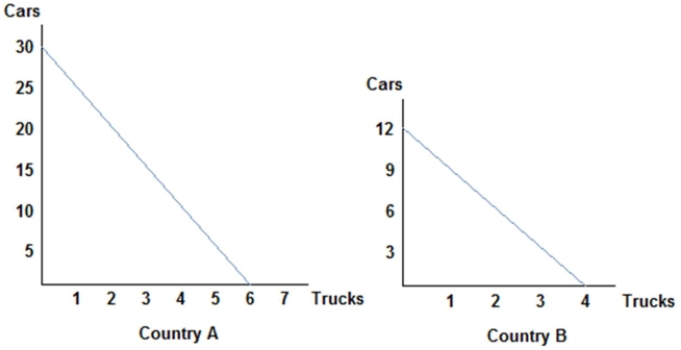 Refer to the figure shown,which represents the production possibilities frontiers for Countries A and B.Which of the following statements is true? The opportunity cost of a truck in Country B is:
A.12 cars.
B.4 trucks.
C.1.5 cars
D.3 cars.
A) measures the opportunity cost of trucks in terms of cars.
B) measures the trade-off that Country A face when deciding how to allocate resources.
C) is constant because the opportunity cost remains constant.
D) All of these statements are true.
Correct Answer:

Verified
Correct Answer:
Verified
Q74: Tom and Jerry have two tasks to
Q75: If society were to experience an increase
Q76: Tom and Jerry have two tasks to
Q77: Suppose that a worker in Country A
Q78: Suppose that a worker in Country A
Q80: Suppose that a worker in Country A
Q81: Tom and Jerry have two tasks to
Q82: <img src="https://d2lvgg3v3hfg70.cloudfront.net/TB1248/.jpg" alt=" Consider the production
Q83: People will choose to specialize and trade
Q84: Suppose an American worker can make 20