Multiple Choice
Figure 21.2 shows the benefit functions for low-ability workers and high-ability workers (A and B) ,along with one indifference curve for each worker type (C and D) .The employer cannot observe worker type directly but has created two positions,E and F,as a screening mechanism.The equilibrium shown here is: 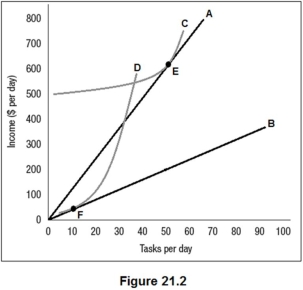
A) a separating equilibrium.
B) a pooling equilibrium.
C) a market unraveling equilibrium.
D) an example of adverse selection.
Correct Answer:

Verified
Correct Answer:
Verified
Q49: Suppose all workers in a certain labor
Q50: If Vincent van Gogh cut off his
Q51: In many cases,signaling offers a partial solution
Q52: Government intervention is frequently justified in insurance
Q53: One way to confront an individual employee
Q55: If in the model for educational attainment
Q56: The value of a worker's marginal product
Q57: In situations where there is a potential
Q58: Moral hazard occurs if one party to
Q59: When employers use screening to distinguish high-ability