Multiple Choice
Figure 21.2 shows the benefit functions for low-ability workers and high-ability workers (A and B) ,along with one indifference curve for each worker type (C and D) .The employer cannot observe worker type directly but has created two positions,E and F,as a screening mechanism.Which of the following is true? 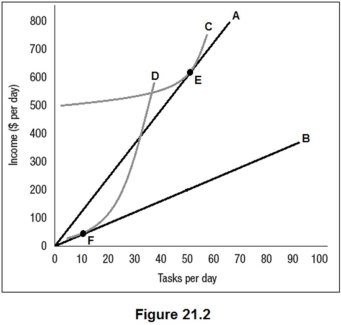
A) Curve A is an indifference curve for a low-ability worker, and curve B is an indifference curve for a high-ability worker.
B) Curve A is the benefit curve for high-ability workers, and curve B is an indifference curve for a high ability worker.
C) Curve A is an indifference curve for a high-ability worker, and curve C is the benefit curve for high-ability workers.
D) Curve A is the benefit curve for high-ability workers, and curve C is an indifference curve for a high ability worker.
Correct Answer:

Verified
Correct Answer:
Verified
Q1: Adverse selection occurs when an informed individual
Q2: Figure 21.2 shows the benefit functions for
Q3: Which of the following explains why a
Q4: In an insurance market,_ occurs when one
Q5: Explain the differences and similarities between screening
Q7: _ has occurred if the manager of
Q8: If a person takes a costly action
Q9: George Akerloff theorized that adverse selection in
Q10: Which of the following is NOT a
Q11: A salesperson works for a car dealership