Multiple Choice
Refer to Figure a.Assuming the solid line in the graph is a constant expected consumption line where Π (the probability of state S) = 0.50,which constant expected consumption line reflects an increase in Π? 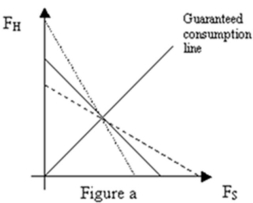
A) The dotted line
B) The dashed line
C) An increase in Π does not result in a change in the expected consumption line.
D) A change in Π results in a parallel shift in the expected consumption line, so neither the dotted nor the dashed line reflects this change.
Correct Answer:

Verified
Correct Answer:
Verified
Q1: Refer to Figures d and e.Bundle A
Q2: Assume Brandon's benefit function for water is
Q3: Assume Brandon's benefit function for water is
Q4: Explain the relationship between the correlation of
Q6: $500 and there are two companies he
Q7: Assume Brandon's benefit function for water is
Q8: Two variables are negatively correlated if:<br>A) they
Q9: Suppose a consumer's expected utility function given
Q10: Suppose Brandon's indifference curves are defined as
Q11: Suppose Lily's indifference curves are defined as