Multiple Choice
Figure 6.2 illustrates a change in the price of soup.From the graph,we can conclude that: 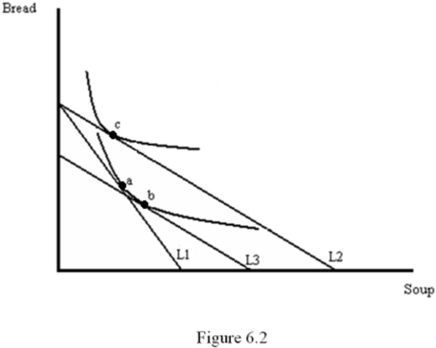
A) the price of soup has increased and soup is a Giffen good.
B) the price of soup has fallen and soup is a Giffen good.
C) the price of soup has fallen and soup is a normal good.
D) the price of soup has fallen and bread is a Giffen good.
Correct Answer:

Verified
Correct Answer:
Verified
Q8: A consumer's _ determines the location of
Q9: If a good is _,the income effect
Q10: Refer to Figure 6.4.If the price of
Q11: The demand curve for a normal good
Q12: Define consumer surplus.Using a graph,explain the change
Q14: Using a graph,explain both the substitution effect
Q15: Refer to Figure 6.1.Assume that L1 represents
Q16: Which of the following statements is true?<br>A)
Q17: Suppose Eddie's demand curve for text messages
Q18: Because individuals initially own more time than