Multiple Choice
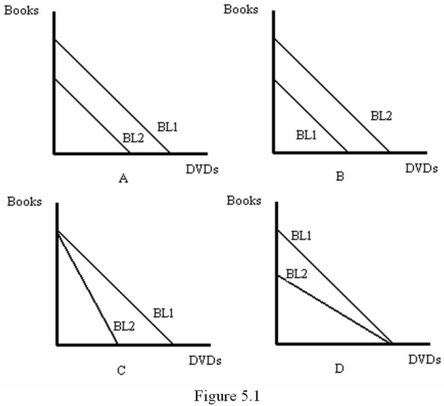
Refer to Figure 5.1.In which graph does a shift from BL1 to BL2 represent an increase in the consumer's income? 
A) A
B) B
C) C
D) D
Correct Answer:

Verified
Correct Answer:
Verified
Related Questions
Q43: Which of the following statements is true?<br>A)
Q44: Using a carefully-labeled diagram,explain an Engel curve
Q45: If electricity is measured on the horizontal
Q46: If a good is normal,then the Engel
Q47: An increase in a consumer's income will
Q49: The price of CDs is $15 and
Q50: A consumer's budget constraint is:<br>A) a positively-sloped
Q51: If the income-consumption path slopes upward,then:<br>A) both
Q52: If an increase in the price of
Q53: A curve that shows how the best