Multiple Choice
Refer to Figure 5.7.Which diagram best represents an Engle curve where soup is a normal good? 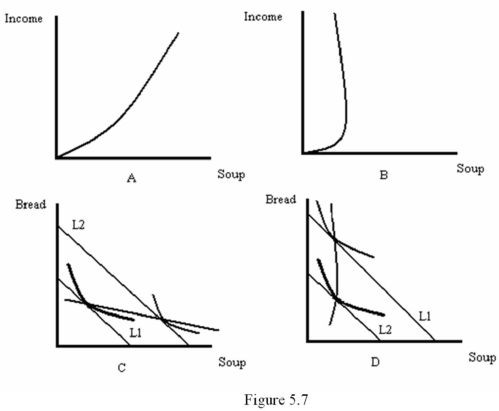
A) A
B) B
C) C
D) D
Correct Answer:

Verified
Correct Answer:
Verified
Related Questions
Q26: When the price elasticity of demand is
Q27: If a change in the price of
Q28: An increase in the price of the
Q29: At a boundary choice:<br>A) the consumer purchases
Q30: Suppose that soup is measured on the
Q32: The curve that shows how the best
Q33: If everyone in an economy buys and
Q34: Suppose a consumer buy books and DVDs.The
Q35: Whenever a consumer purchases good X but
Q36: When a good is normal:<br>A) an increase