Multiple Choice
Refer to Figure 5.7.Which diagram best represents an income-consumption curve where soup is a normal good? 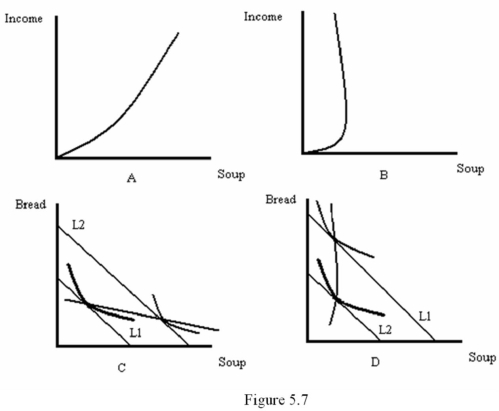
A) A
B) B
C) C
D) D
Correct Answer:

Verified
Correct Answer:
Verified
Related Questions
Q64: Which of the following statements is true?<br>A)
Q65: Suppose a consumer buys pizza (P)and soft
Q66: Refer to Table 5.1,which shows Madeline's preference
Q67: Refer to Figure 5.7.Which diagram best represents
Q68: Choices that do not exhaust the consumer's
Q70: Refer to Figure 5.6.Which diagram shows an
Q71: A curve that describes the relationship between
Q72: Refer to Figure 5.4.Which consumption bundle would
Q73: When the government provides food stamps to
Q74: Suppose that an individual consumes just hamburgers