Multiple Choice
The graph below most likely depicts a(n) : 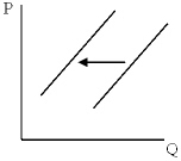
A) supply increase.
B) supply decrease.
C) decrease in demand.
D) increase in demand.
Correct Answer:

Verified
Correct Answer:
Verified
Related Questions
Q31: A price ceiling is binding when it
Q43: Coca-Cola bottlers increased their prices as the
Q56: A safety report is released that contends
Q57: The general consensus on minimum wage laws
Q58: The main purpose of government price controls
Q86: A more efficient means of processing tree
Q128: Whenever a price ceiling is imposed in
Q131: If market demand increases and market supply
Q239: If a price ceiling of $4.00 per
Q274: If a price floor is not binding,