Multiple Choice
Exhibit 6-2 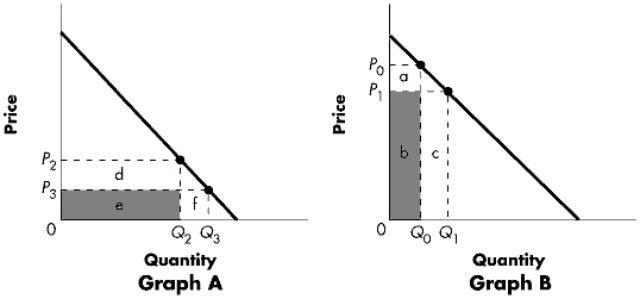 Refer to Exhibit 6-2.Elasticity varies along a linear demand curve.Graph B represents the section of the curve where:
A) the curve is elastic.
B) Ed is > 1.
C) starting at P1, an increase in price will lead to a decrease in total revenue.
D) all of the above are correct.
Correct Answer:

Verified
Correct Answer:
Verified
Q35: When a product's price increases from $800
Q95: If a good has a perfectly inelastic
Q104: If an increase in price causes total
Q128: If demand is unit elastic:<br>A) revenue and
Q130: Which of the following is associated with
Q131: Total revenue represents the amount that:<br>A) sellers
Q133: In the graph below,a tax increase would
Q136: The nation's largest cable TV company tested
Q137: Moving along an inelastic portion of a
Q139: Assume the price of widgets increases by