Multiple Choice
Exhibit 6-3 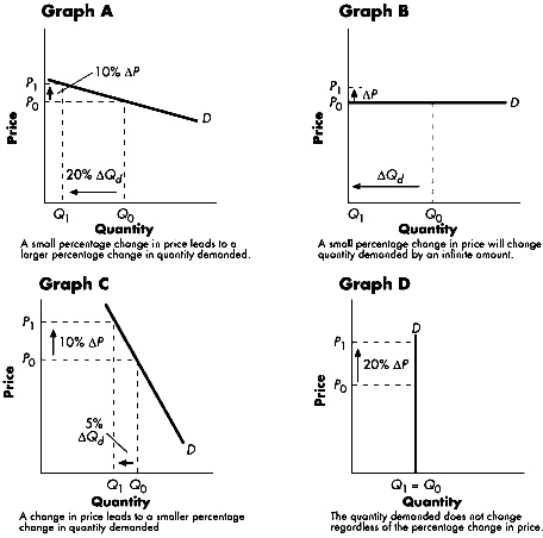 Refer to Exhibit 6-3.The graph that best illustrates a perfectly inelastic demand curve is:
A) Graph A.
B) Graph B.
C) Graph C.
D) Graph D.
Correct Answer:

Verified
Correct Answer:
Verified
Related Questions
Q17: The price elasticity of demand coefficient for
Q18: Exhibit 6-4 <img src="https://d2lvgg3v3hfg70.cloudfront.net/TB2081/.jpg" alt="Exhibit 6-4
Q24: If the elasticity of supply coefficient for
Q24: In the graph below,a tax increase would
Q102: If one is interested in knowing whether
Q111: If a small change in price will
Q145: The price of a new toy increases
Q169: If the price elasticity of demand was
Q235: Put the following products in order from
Q238: If the cross price elasticity of demand