Multiple Choice
Exhibit 6-3 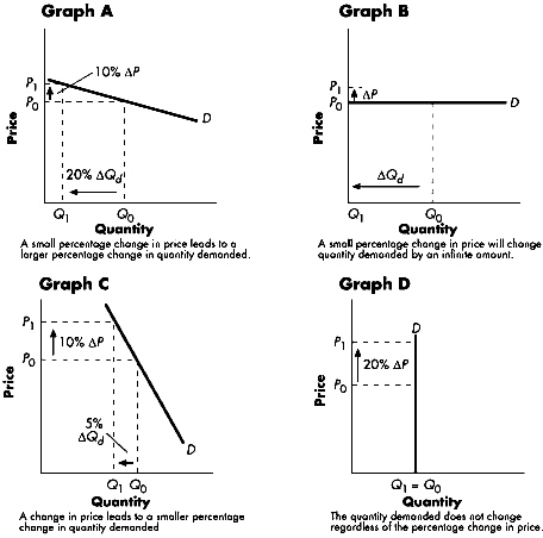 Refer to Exhibit 6-3.The graph that best illustrates a perfectly elastic demand curve is
A) Graph A.
B) Graph B.
C) Graph C.
D) Graph D.
Correct Answer:

Verified
Correct Answer:
Verified
Related Questions
Q25: The price elasticity of demand for tickets
Q100: Ceteris paribus,if an 8% increase in price
Q102: Which of the following is true of
Q129: The formula for calculating the cross price
Q149: Chicken and fish are substitutes. Therefore, the
Q168: The price of stadium seats at a
Q190: If the short run elasticity of demand
Q197: A 10% decrease in the price of
Q217: Certain goods are related so that an
Q259: Price elasticity of demand is a measure