Multiple Choice
Exhibit 6-4 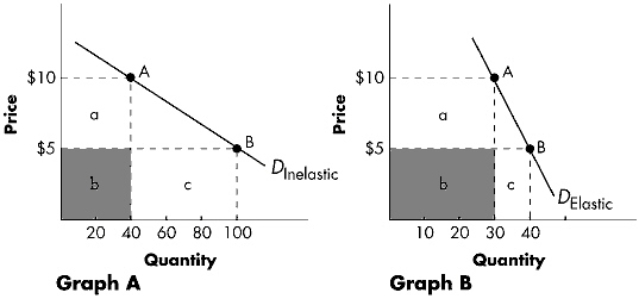 Refer to Exhibit 6-4.Graph B represents a demand curve that is relatively ____.Total revenue ____ as the price decreases from $10 to $5.
A) inelastic; decreases
B) elastic; decreases
C) elastic; increases
D) inelastic; increases
Correct Answer:

Verified
Correct Answer:
Verified
Related Questions
Q10: The current supply of Rembrandt paintings:<br>A)is perfectly
Q31: When a 5% increase in price leads
Q42: If the supply of good A is
Q61: The nation's largest cable TV company tested
Q68: What type of demand curve is depicted
Q78: The Book Nook reduces prices by 20%.
Q96: If the elasticity of demand for bagels
Q134: A 25% decrease in the price of
Q140: You have been hired by the city
Q173: The elasticity of supply coefficient for lobster