Multiple Choice
Figure 5-1 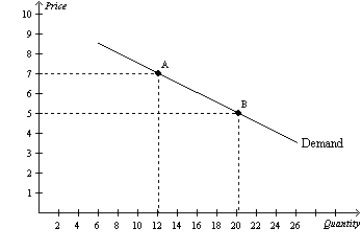
-Refer to Figure 5-1. Between point A and point B on the graph, demand is
A) perfectly elastic.
B) inelastic.
C) unit elastic.
D) elastic, but not perfectly elastid.
Correct Answer:

Verified
Correct Answer:
Verified
Q3: Figure 5-18 <img src="https://d2lvgg3v3hfg70.cloudfront.net/TB2297/.jpg" alt="Figure 5-18
Q14: The price elasticity of supply measures how
Q18: Given the market for illegal drugs,when the
Q80: Income elasticity of demand measures how<br>A)the quantity
Q82: Suppose that when the price rises by
Q131: Suppose the price of a bag of
Q154: The demand for soap is more elastic
Q293: Table 5-4<br>The following table shows the demand
Q542: When the price of a good is
Q597: Table 5-11 <img src="https://d2lvgg3v3hfg70.cloudfront.net/TB1273/.jpg" alt="Table 5-11