Multiple Choice
Figure 5-15 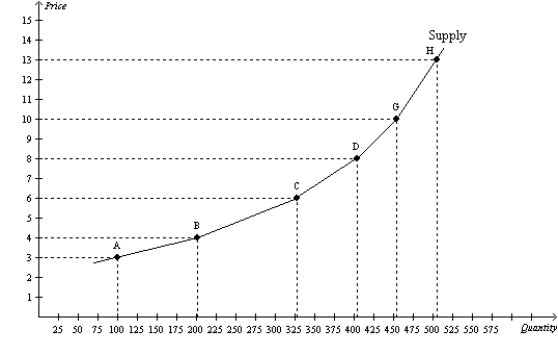
-Refer to Figure 5-15. Using the midpoint method, what is the price elasticity of supply between points B and C?
A) 1.19
B) 1.67
C) 0.84
D) 0.61
Correct Answer:

Verified
Correct Answer:
Verified
Q6: Figure 5-3 <img src="https://d2lvgg3v3hfg70.cloudfront.net/TB2297/.jpg" alt="Figure 5-3
Q27: A linear,upward-sloping supply curve has<br>A)a constant slope
Q49: An advantage of using the midpoint method
Q54: Figure 5-8<br> <img src="https://d2lvgg3v3hfg70.cloudfront.net/TB7555/.jpg" alt="Figure 5-8
Q58: Figure 5-14 <img src="https://d2lvgg3v3hfg70.cloudfront.net/TB2297/.jpg" alt="Figure 5-14
Q119: Suppose you manage a baseball stadium. To
Q212: For a particular good,a 2 percent increase
Q218: Suppose you are in charge of setting
Q223: An increase in price causes an increase
Q389: Which of the following expressions is valid