Multiple Choice
Figure 9-24
The following diagram shows the domestic demand and supply in a market. Assume that the world price in this market is $20 per unit. 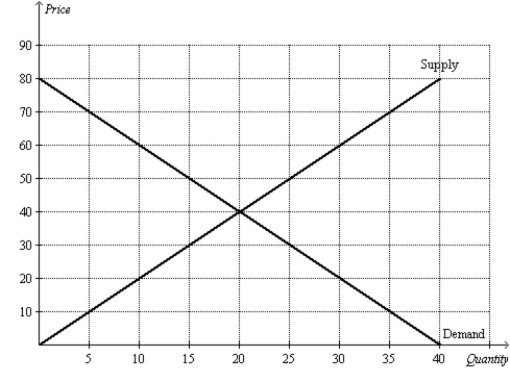
-Refer to Figure 9-24. Suppose the government imposes a tariff of $10 per unit. The deadweight loss caused by the tariff is
A) $25.
B) $50.
C) $75.
D)
D) $100.
Correct Answer:

Verified
Correct Answer:
Verified
Q2: Figure 9-16.The figure below illustrates a tariff.On
Q26: If Honduras were to subsidize the production
Q29: Figure 9-27<br>The following diagram shows the domestic
Q30: Figure 9-28<br>The following diagram shows the domestic
Q39: Suppose France subsidizes French wheat farmers,while Germany
Q96: Figure 9-1<br>The figure illustrates the market for
Q148: Figure 9-21<br>The following diagram shows the domestic
Q284: Figure 9-9 <img src="https://d2lvgg3v3hfg70.cloudfront.net/TB2186/.jpg" alt="Figure 9-9
Q287: Scenario 9-2<br>• For a small country called
Q298: Relative to a situation in which domestic