Multiple Choice
Figure 10-7 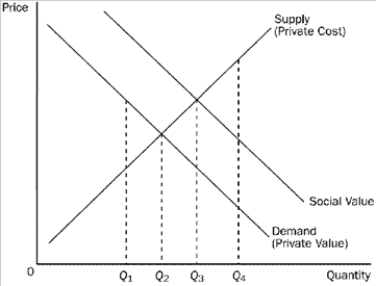
-Refer to Figure 10-7. Which quantity represents the social optimum for this market?
A) Q1.
B) Q2.
C) Q3.
D) Q4.
Correct Answer:

Verified
Correct Answer:
Verified
Related Questions
Q14: When a driver enters a crowded highway
Q66: Table 10-6<br>The following table shows the total
Q116: Which of the following policies is an
Q138: The tax on gasoline causes deadweight losses,
Q161: Education is heavily subsidized through public schools
Q185: Corrective taxes that are imposed upon the
Q186: Figure 10-12 <img src="https://d2lvgg3v3hfg70.cloudfront.net/TB1273/.jpg" alt="Figure 10-12
Q247: To economists, good environmental policy begins by
Q249: Honey producers provide a positive externality to
Q433: If the social value of producing a