Multiple Choice
Figure 15-4 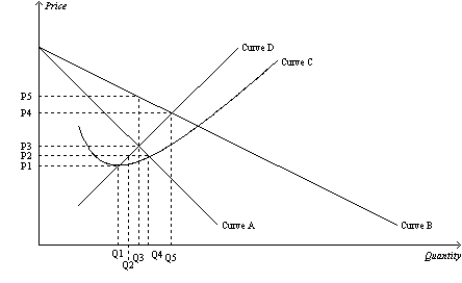
-Refer to Figure 15-4. The average total cost curve for a monopoly firm is depicted by curve
A) A.
B) B.
C) C.
D) D.
Correct Answer:

Verified
Correct Answer:
Verified
Q47: A benefit to society of the patent
Q149: A monopolist produces where P > MC
Q219: A monopolist that practices perfect price discrimination<br>A)creates
Q220: Figure 15-4 <img src="https://d2lvgg3v3hfg70.cloudfront.net/TB1273/.jpg" alt="Figure 15-4
Q221: "Monopolists do not worry about efficient production
Q222: Price discrimination is the business practice of<br>A)bundling
Q225: The deadweight loss that arises from a
Q226: Table 15-17<br>A monopolist faces the following demand
Q228: Figure 15-5 <img src="https://d2lvgg3v3hfg70.cloudfront.net/TB1273/.jpg" alt="Figure 15-5
Q229: Figure 15-9 <img src="https://d2lvgg3v3hfg70.cloudfront.net/TB1273/.jpg" alt="Figure 15-9