Multiple Choice
Figure 21-3
In each case, the budget constraint moves from BC-1 to BC-2. 
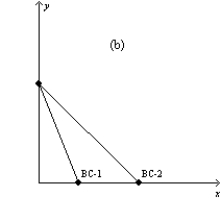
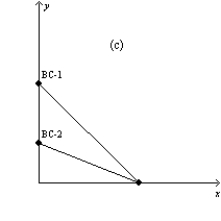
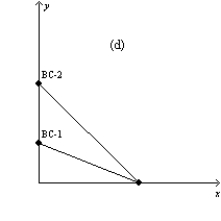
-Refer to Figure 21-3. Which of the graphs in the figure reflects a decrease in the price of good Y only?
A) graph a
B) graph b
C) graph c
D) graph d
Correct Answer:

Verified
Correct Answer:
Verified
Related Questions
Q71: The following diagram shows a budget constraint
Q72: Jake experiences an increase in his wages.
Q75: As long as a consumer remains on
Q76: Figure 21-31 The figure shows two indifference
Q77: When economists describe preferences, they often use
Q78: A consumer<br>A)is equally satisfied with any indifference
Q79: Figure 21-31 The figure shows two indifference
Q84: A typical indifference curve is upward sloping.
Q142: The marginal rate of substitution is the
Q189: If Priscilla regards cheese and crackers as