Multiple Choice
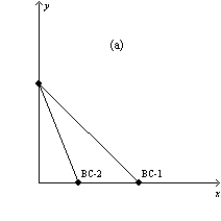
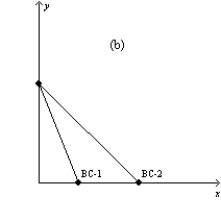
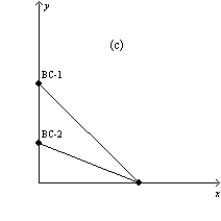
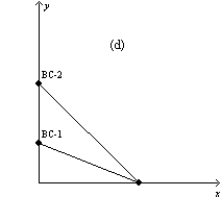
Figure 21-3
In each case, the budget constraint moves from BC-1 to BC-2. 


-Refer to Figure 21-3. Which of the graphs in the figure could reflect a simultaneous decrease in the price of good X and increase in the price of good Y?
(i) graph a
(ii) graph b
(iii) graph c
(iv) graph d
A) (ii) only
B) (iii) only
C) (ii) or (iv) only
D) None of the above is correct.
Correct Answer:

Verified
Correct Answer:
Verified
Q8: Suppose that you have $100 today and
Q67: The following diagram shows a budget constraint
Q73: A rational person can have a negatively-sloped
Q149: The income effect of a price change
Q155: Figure 21-1 The downward-sloping line on the
Q257: Figure 21-25 The figure pertains to a
Q498: Scenario 21-4 Frank spends all of his
Q502: Figure 21-1 The downward-sloping line on the
Q503: When Jamar has an income of $2,000,
Q535: When indifference curves are bowed in toward