Multiple Choice
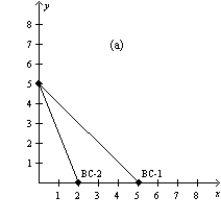
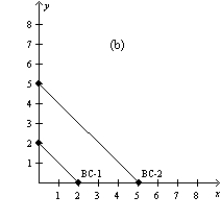
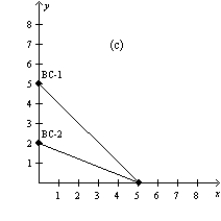
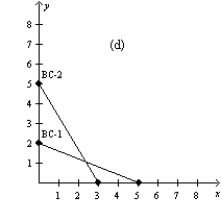
Figure 21-4
In each case, the budget constraint moves from BC-1 to BC-2. 


-Refer to Figure 21-4. Which of the graphs in the figure could reflect a simultaneous increase in the price of good X and decrease in the price of good Y?
A) graph a
B) graph b
C) graph c
D) graph d
Correct Answer:

Verified
Correct Answer:
Verified
Q193: The income effect in the work-leisure model
Q205: Figure 21-6 <img src="https://d2lvgg3v3hfg70.cloudfront.net/TB1273/.jpg" alt="Figure 21-6
Q206: Figure 21-26 <img src="https://d2lvgg3v3hfg70.cloudfront.net/TB1273/.jpg" alt="Figure 21-26
Q207: The substitution effect from an increase in
Q208: Bundle A contains 10 units of good
Q209: Laura consumes only beer and chips. Her
Q212: A Giffen good is one for which
Q213: Mark spends his weekly income on gin
Q214: The following diagram shows one indifference curve
Q215: A Giffen good is a good for