Multiple Choice
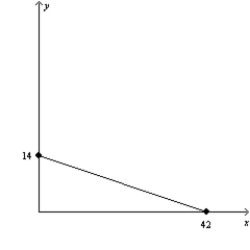
Figure 21-5
(a)
(b) 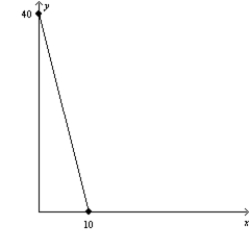
-Refer to Figure 21-5. In graph (a) , if income is equal to $200, then the price of good X is
A) $12.
B) $16.
C) $20.
D) $24.
Correct Answer:

Verified
Correct Answer:
Verified
Related Questions
Q57: The rate at which a consumer is
Q541: The following diagram shows a budget constraint
Q542: When Matt has an income of $2,000,
Q543: Utility measures the<br>A)income a consumer receives from
Q544: Suppose that Sam likes pears twice as
Q545: When indifference curves are bowed inward, the
Q547: Figure 21-31 The figure shows two indifference
Q548: Figure 21-19 <img src="https://d2lvgg3v3hfg70.cloudfront.net/TB1273/.jpg" alt="Figure 21-19
Q549: Janet knows that she will ultimately face
Q550: Using the graph shown, construct a demand