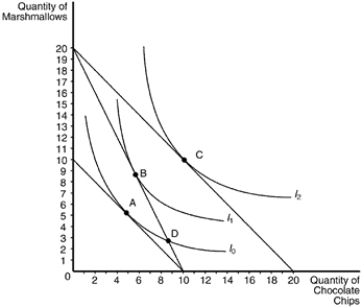
Figure 21-20 The Following Graph Illustrates a Representative Consumer's Preferences for Marshmallows
Multiple Choice
Figure 21-20
The following graph illustrates a representative consumer's preferences for marshmallows and chocolate chip cookies: 
-Refer to Figure 21-20. Assume that the consumer depicted the figure has an income of $50. Based on the information available in the graph, which of the following price-quantity combinations would be on her demand curve for chocolate chips if the price of marshmallows is $2.50?
A) P=$2.50, Q=6
B) P=$2.50, Q=10
C) P=$5.00, Q=3
D) P=$5.00, Q=5
Correct Answer:

Verified
Correct Answer:
Verified
Q15: The indifference curves for left gloves and
Q39: Giffen goods are<br>A)normal goods for which the
Q42: Economic studies of lottery winners and people
Q45: Figure 21-31 The figure shows two indifference
Q46: Jerry consumes two goods, hamburgers and ice
Q47: A consumer chooses an optimal consumption point
Q48: Figure 21-32 The figure shows three indifference
Q49: Figure 21-10 <img src="https://d2lvgg3v3hfg70.cloudfront.net/TB1273/.jpg" alt="Figure 21-10
Q145: A consumer's budget constraint is drawn with
Q201: A family on a trip budgets $800