Multiple Choice
Figure 21-23 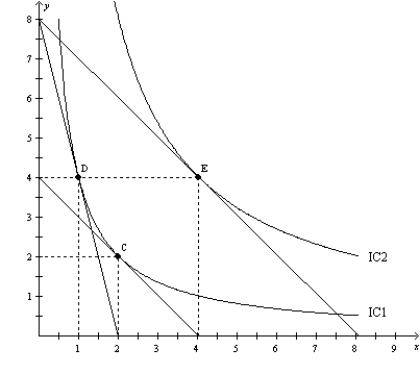
-Refer to Figure 21-23. When the price of X is $80, the price of Y is $20, and the consumer's income is $160, the consumer's optimal choice is D. Then the price of X decreases to $20. The demand curve can be illustrated as the movement from
A) D to E.
B) D to C.
C) C to E.
D) E to D.
Correct Answer:

Verified
Correct Answer:
Verified
Q74: A consumer's budget constraint for goods X
Q81: If consumers purchase more of a good
Q83: Assume that a college student purchases only
Q84: If two bundles of goods give a
Q85: A normal good is one<br>A)the average consumer
Q87: Suppose that Milton likes to consume one
Q89: Figure 21-9 <img src="https://d2lvgg3v3hfg70.cloudfront.net/TB1273/.jpg" alt="Figure 21-9
Q90: When a consumer is purchasing the best
Q92: Suppose that Elmer's hourly wage increases, and
Q93: Figure 21-5<br>(a)<br>(b) <img src="https://d2lvgg3v3hfg70.cloudfront.net/TB1273/.jpg" alt="Figure 21-5 (a)