Multiple Choice
Samples of 200 parts were taken every day and the number of defectives was counted. What are the upper and lower limits for the percent defective chart? 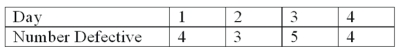
A) 0.02 and 0
B) 0.2970 and 0
C) 0.0297 and 0
D) 0.0497 and 0
Correct Answer:

Verified
Correct Answer:
Verified
Related Questions
Q51: Control charts can be developed for both
Q53: If the binomial distribution is used to
Q53: Assignable causes are usually large in number
Q54: A manufacturer of cell phones counts the
Q55: How is the center line of a
Q56: A manufacturer of golf club shafts inspects
Q59: A new printing machine is set or
Q61: The Quality Assurance Department selected 12 samples
Q62: In a control chart, expected variation is
Q89: Explain the risks of acceptance sampling.