Short Answer
The table below shows the sales for a plastics manufacturer recorded over the past year. The seasonal indexes for each quarter are also provided. To track the trend for these four quarters, use the indexes to deseasonalize the sales data 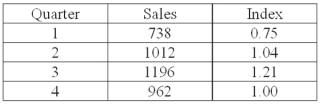 Overall, sales are:
Correct Answer:

Verified
Correct Answer:
Verified
Related Questions
Q17: The forecast for the third quarter is
Q21: What method is used to determine the
Q22: What transformation should be used for a
Q24: Using the following time series data, <img
Q34: The forecast for the third quarter is
Q44: A typical seasonal index of 103.7 for
Q46: For quarterly seasonal indexes,the total of the
Q68: The trend forecast equation is Ŷ =
Q74: In the linear trend equation, the letter
Q139: Autocorrelation occurs when successive residuals are _.