Multiple Choice
A random sample of 30 executives from companies with assets over $1 million was selected and asked for their annual income and level of education. The ANOVA comparing the average income among three levels of education rejected the null hypothesis. The Mean Square Error (MSE) was 243.7. The following table summarized the results: 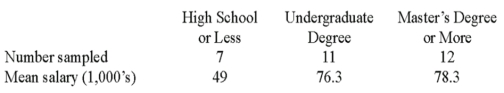
When comparing the mean annual incomes for executives with Undergraduate and Master's Degree or more, the following 95% confidence interval can be constructed:
A) 2.0 2.052 * 6.51
B) 2.0 3.182 * 6.51
C) 2.0 2.052 * 42.46
D) 2.0 3.182 * 42.46
Correct Answer:

Verified
Correct Answer:
Verified
Q3: One characteristic of the F-distribution is that
Q30: Assuming that the larger of two variances
Q31: Two accounting professors decided to compare the
Q32: What is the shape of the F
Q33: A bottle cap manufacturer with four machines
Q34: If the computed value of F is
Q36: Two accounting professors decided to compare the
Q37: In ANOVA analysis, when the null hypothesis
Q38: Two accounting professors decided to compare the
Q40: A bottle cap manufacturer with four machines