Multiple Choice
A random sample of 40 companies with assets over $10 million was selected and asked for their annual computer technology expense and industry. The ANOVA comparing the average computer technology expense among three industries rejected the null hypothesis. The Mean Square Error (MSE) was 195. The following table summarized the results: 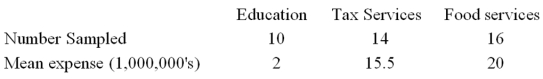 Based on the comparison between the mean annual computer technology expense for companies in the Education and Tax services industries,
A) A confidence interval shows that the mean annual computer technology expenses are not significantly different.
B) The ANOVA results show that the mean annual computer technology expenses are significantly different.
C) A confidence interval shows that the mean annual computer technology expenses are significantly different.
D) The ANOVA results show that the mean annual computer technology expenses are not significantly different.
Correct Answer:

Verified
Correct Answer:
Verified
Q2: Two accounting professors decided to compare the
Q3: The college of business was interested in
Q6: A random sample of 20 female executives
Q7: An ANOVA showed the following comparison of
Q10: The human resources department of a software
Q11: Several employees have submitted different methods of
Q15: A large department store examined a sample
Q38: When testing for differences between treatment means,the
Q42: What distribution does the F-distribution approach as
Q71: When a blocking effect is included in