Multiple Choice
In the following graph, 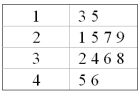
A) There are 16 observations.
B) There are four observations in the second class.
C) There are ten observations less than thirty.
D) There are ten observations greater than thirty.
Correct Answer:

Verified
Correct Answer:
Verified
Q6: A dot plot is useful for quickly
Q45: Quartiles divide a distribution into four equal
Q52: The following stem-and-leaf display reports the number
Q54: The following stem and leaf display reports
Q55: The research director of a large oil
Q56: A telemarketing firm is monitoring the performance
Q57: For the following data, are any of
Q60: The Pearson's coefficient of skewness (Sk) measures
Q62: The following graph is a <img src="https://d2lvgg3v3hfg70.cloudfront.net/TB2538/.jpg"
Q63: What does the interquartile range describe?<br>A) The