Multiple Choice
A student was interested in the cigarette smoking habits of college students and collected data from an unbiased random sample of students. The data is summarized in the following table: 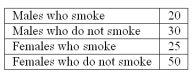 What type of chart best represents the frequency table?
A) Bar Chart
B) Pie Chart
C) Scatter plot
D) Frequency Polygon
Correct Answer:

Verified
Correct Answer:
Verified
Q7: Refer to the following distribution of ages:
Q9: Refer to the following breakdown of responses
Q11: Refer to the following information from a
Q13: Refer to the following breakdown of responses
Q14: Refer to the following breakdown of responses
Q17: The following frequency distribution shows the distribution
Q25: To construct a pie chart,relative class frequencies
Q81: For a frequency distribution of qualitative data,
Q90: For a frequency distribution of quantitative data,
Q129: A data set has 200 observations. In