Multiple Choice
The age distribution of a sample of part-time employees at Lloyd's Fast Food Emporium is: 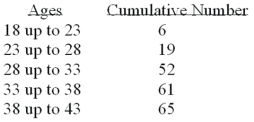 What type of chart should be drawn to present this data?
A) Histogram
B) Simple line chart
C) Cumulative Frequency Distribution
D) Pie chart
E) Frequency polygon
Correct Answer:

Verified
Correct Answer:
Verified
Q38: In a bar chart,the heights of the
Q40: To summarize the gender of students attending
Q101: When data is collected using a qualitative,
Q102: Refer to the following breakdown of responses
Q104: The following frequency distribution shows the distribution
Q105: When data is collected using a quantitative,
Q107: The relative frequency for a class represents
Q108: Refer to the following ages (rounded to
Q109: What is the following table called? <img
Q111: The following frequency distribution shows the distribution