Multiple Choice
Refer to the following breakdown of responses to a survey of room service in a hotel. 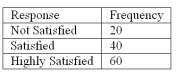 What type of chart should be used to describe the frequency table?
A) Pie chart
B) Bar chart
C) Histogram
D) Frequency Polygon
Correct Answer:

Verified
Correct Answer:
Verified
Related Questions
Q33: To construct a pie chart, the class
Q55: In a bar chart, the x-axis is
Q99: A small sample of computer operators shows
Q114: The following frequency distribution shows the distribution
Q115: A student was studying the political party
Q116: The following frequency distribution shows the distribution
Q117: Refer to the following distribution of ages:
Q118: A group of 100 students was surveyed
Q122: Refer to the following breakdown of responses
Q125: A _ chart is useful for displaying