Multiple Choice
Refer to the following breakdown of responses to a survey of room service in a hotel. 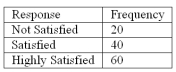 What type of chart should be used to show relative class frequencies?
A) Pie chart
B) Bar chart
C) Histogram
D) Frequency Polygon
Correct Answer:

Verified
Correct Answer:
Verified
Related Questions
Q1: Refer to the following wage breakdown for
Q2: Refer to the following breakdown of responses
Q3: In a frequency distribution, the number of
Q6: In constructing a frequency polygon, class frequencies
Q7: Refer to the following distribution of ages:
Q9: Refer to the following breakdown of responses
Q11: Refer to the following information from a
Q51: A frequency distribution for nominal data requires
Q90: For a frequency distribution of quantitative data,
Q129: A data set has 200 observations. In