Essay
Refer to the following breakdown of responses to a survey of room cleanliness in a hotel. 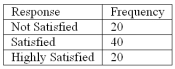 Draw a pie chart that illustrates the relative frequencies.
Correct Answer:

Verified
The pie chart should be divided into thr...View Answer
Unlock this answer now
Get Access to more Verified Answers free of charge
Correct Answer:
Verified
View Answer
Unlock this answer now
Get Access to more Verified Answers free of charge
Q46: Refer to the following breakdown of responses
Q47: The monthly salaries of a sample of
Q49: When data is collected using a qualitative,
Q50: A student was interested in the cigarette
Q51: Refer to the following information from a
Q52: Refer to the following distribution: <img src="https://d2lvgg3v3hfg70.cloudfront.net/TB2538/.jpg"
Q53: In a deck of cards, a class
Q78: A data set has 200 observations. In
Q85: A _ chart is useful for displaying
Q132: To construct a histogram, the class frequencies