Multiple Choice
Refer to Figure 5.2.On the graph that shows total costs,what is the level of variable costs when 6 units are produced? 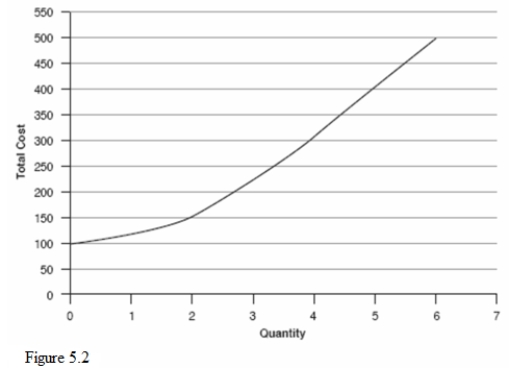
A) $50
B) $100
C) $400
D) $500
Correct Answer:

Verified
Correct Answer:
Verified
Related Questions
Q1: Assume your company produces good X using
Q2: For many corporations,a major portion of the
Q3: Which of the following is a possible
Q5: A production function of the form Q
Q6: Which of the following statements about the
Q7: If a company has a cost curve
Q8: Currently,the marginal cost equation for a shoe
Q9: If a company has significant economies of
Q10: Isoquants from fixed-proportion production functions are<br>A)downward sloping.<br>B)shaped
Q11: If a company has a cost curve