Multiple Choice
The following diagram shows a market in equilibrium.If there was a $3.50 price floor, 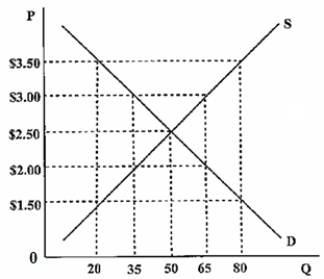
A) the quantity demanded would be 65 units.
B) the quantity demanded would be <
C) there would be a shortage of 60 units.
D) there would be a surplus of 60 units.
Correct Answer:

Verified
Correct Answer:
Verified
Related Questions
Q5: Assume the demand function for basketballs is
Q6: There is an increase in incomes due
Q7: Let Q<sub>d</sub> = 10 - 2P and
Q8: A price ceiling on a good will
Q9: Tom and Jerry have been roommates for
Q11: A working knowledge of both markets and
Q12: The war in Iraq comes to an
Q13: The demand and supply curves in the
Q14: There is an OPEC cartel that reduces
Q15: Draw supply and demand curves.Show the impact