Multiple Choice
The demand and supply curves in the market for gasoline are illustrated in the graph below. 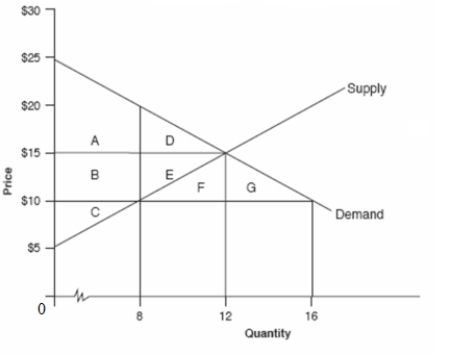 Starting at the equilibrium point,if the government imposes a price ceiling of $10,the deadweight loss will be the area ______.
A) D + E
B) F + G
C) D
D) E
Correct Answer:

Verified
Correct Answer:
Verified
Related Questions
Q14: There is an OPEC cartel that reduces
Q15: Draw supply and demand curves.Show the impact
Q16: Assume the market for pencils is competitive
Q17: Externalities exist when the actions of one
Q18: Assume the market for ceiling fans is
Q20: If the price of movie tickets doubles,then<br>A)the
Q21: If demand is represented by Q<sub>d</sub> =
Q22: Suppose Sam and Kevin can produce pens
Q23: What are externalities and why is Ronald
Q24: Which one of the following does not