Essay
The following data of causes of absenteeism for a fellow student for the year just completed were available.
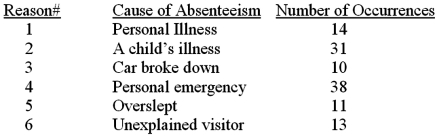 Required:
1. Use the above information to construct a histogram.
2. Use the information from requirement (1) to prepare a Pareto diagram.
(Note: In constructing the above two items, you can use the information in column 1 to describe each of the identified causes. That is, you can use the reference numbers rather than the actual verbal descriptions. presented in column 2.)
3. Within the context of managing and control quality, what is the primary purpose played by tools such as histograms and Pareto diagrams?
Correct Answer:

Verified
Answer may vary
Feedback:
1. Histogram  ...
...View Answer
Unlock this answer now
Get Access to more Verified Answers free of charge
Correct Answer:
Verified
Feedback:
1. Histogram
View Answer
Unlock this answer now
Get Access to more Verified Answers free of charge
Q23: All the following are examples of internal
Q45: List three examples of quality improvement initiatives
Q52: In a Cost-of-Quality (COQ) reporting framework, costs
Q94: A graphical method that organizes a chain
Q105: In a Cost of Quality (COQ) report,
Q114: Which of the following items is not
Q115: Verizon Manufacturing Company spent $400,000 in 2019
Q132: Studies have shown that improvements in quality
Q141: The desired target quality characteristic of a
Q146: Provide four reasons why both internal and