Multiple Choice
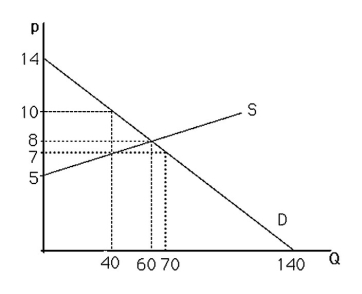
-The above figure shows a graph of the market for pizzas in a large town.If the price price rises from 7 to 8,what is the change in quantity demanded for pizzas?
A) -10
B) -30
C) -20
D) 20
Correct Answer:

Verified
Correct Answer:
Verified
Related Questions
Q13: Consider the following products.Which of them has
Q52: Only in the case of perfectly inelastic
Q52: Show that the slope of the market
Q56: When import restrictions are placed on a
Q58: Suppose the demand for Digital Video Recorders
Q59: Suppose the log-linear demand for widgets is
Q60: The demand for pizzas in a large
Q63: According to the Law of Demand,the demand
Q78: The supply curve for tickets for a
Q112: A drought in the Midwest will raise