Multiple Choice
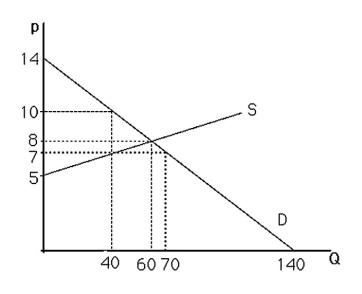
-The above figure shows a graph of the market for pizzas in a large town.At a price of $7,there will be
A) excess demand.
B) excess supply.
C) equilibrium.
D) zero demand.
Correct Answer:

Verified
Correct Answer:
Verified
Related Questions
Q55: <img src="https://d2lvgg3v3hfg70.cloudfront.net/TB6808/.jpg" alt=" -The above figure
Q60: If the demand for orange juice is
Q69: Equilibrium is defined as a situation in
Q88: In the case of a linear demand
Q94: The demand for pizzas in a large
Q96: Suppose the demand for Digital Video Recorders
Q98: Suppose the current price and quantity of
Q99: If the price elasticity of demand for
Q120: As prices change,the elasticity of supply describes
Q128: <img src="https://d2lvgg3v3hfg70.cloudfront.net/TB6808/.jpg" alt=" -The above figure